
Direct answer
What is Connected Papers?
Connected Papers builds visual similarity graphs from academic papers, helping researchers discover relevant prior works, derivative literature, and field trends across disciplines.
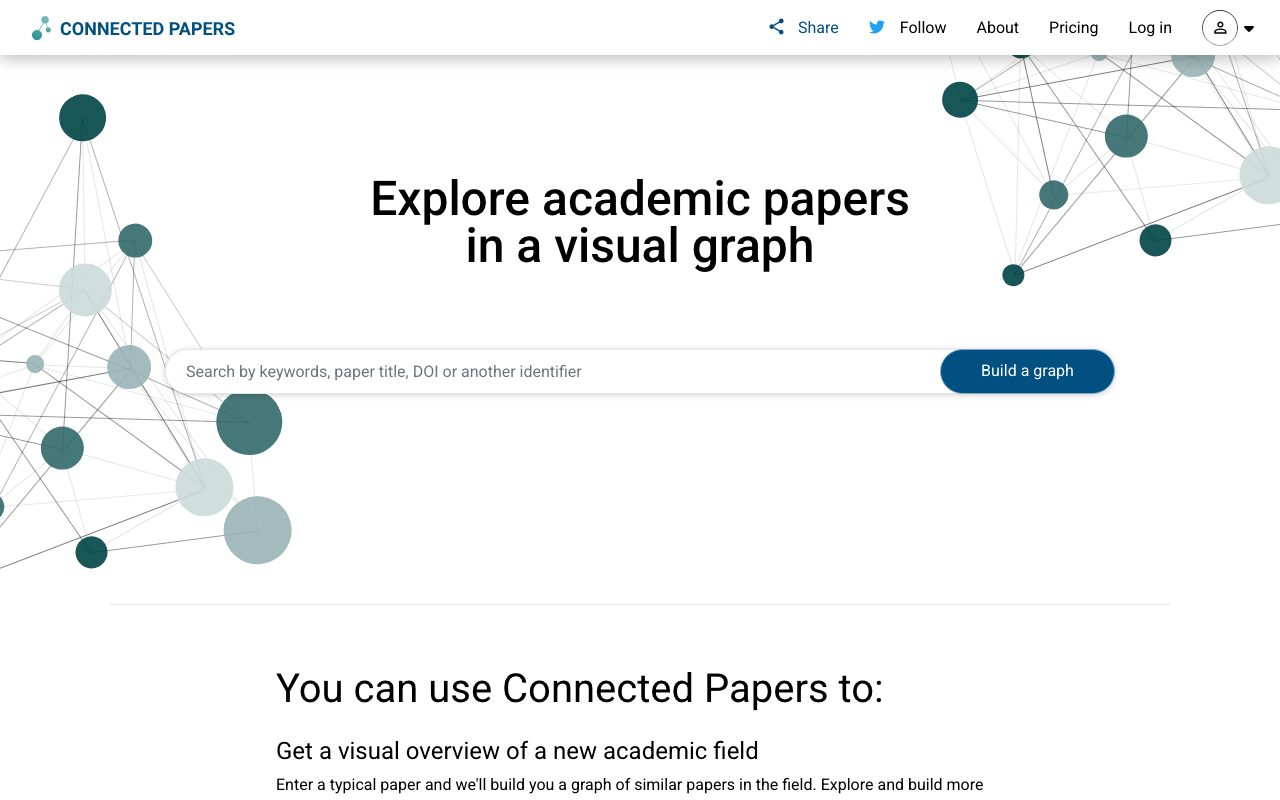
Connected Papers is an academic exploration platform designed to help researchers visually analyze scientific literature. Powered by the Semantic Scholar database spanning hundreds of millions of papers across disciplines, the service generates visual graphs based on co-citation and bibliographic coupling rather than direct citation chains alone. Starting from a single seed paper or search query, the tool constructs a network graph showing closely related publications, their relative influence, and their connections. Researchers can toggle between distinct analytical perspectives, including a Prior Works view to identify foundational ancestor papers and a Derivative Works view to locate subsequent literature reviews and state-of-the-art advances. In addition to single-paper graphs, the system supports multi-origin graphs, saved paper lists, and graph history tracking. Its database covers natural sciences, machine learning, medicine, humanities, and social sciences, making it a cross-disciplinary utility for literature reviews, bibliography assembly, and landscape exploration.
Unlike standard search engines that return linear lists of citations, Connected Papers visualizes citation clusters and similarity networks, surfacing seminal prior papers and recent derivative works without requiring manual bibliography tracing.
Product capabilities
Key features
Visual Similarity Graphs
Generates interactive network graphs that cluster academic papers based on bibliographic coupling and co-citation similarity.
Prior Works View
Surfaces foundational ancestor papers that were cited most commonly by the papers clustered in your current graph.
Derivative Works View
Highlights recent literature reviews and state-of-the-art advancements that cited multiple papers within the graph.
Multi-Origin Graphs
Allows researchers to initiate visual graphs using multiple reference papers to explore intersectional topics.
Semantic Scholar Integration
Draws metadata and citations from the Semantic Scholar database covering hundreds of millions of scientific papers across all domains.
Saved Papers and History
Enables authenticated users to bookmark key papers and revisit past generated graphs.
Workflow
How Connected Papers works
- Enter a paper title, DOI, or search topic into the search bar.
- Connected Papers analyzes co-citations and bibliographic metrics from the Semantic Scholar database.
- A graph network is rendered showing related papers, clustering strength, and connection intensity.
- Explore ancestor papers via Prior Works or recent literature surveys via Derivative Works.
- Save papers to your account or launch new multi-origin graphs to broaden the scope.
Practical fit
Who should use Connected Papers?
Exploring New Research Fields
Seed the engine with an introductory paper to visualize prevailing trends, influential authors, and central works in an unfamiliar topic.
Thesis Bibliography Construction
Fill reference gaps and locate overlooked seminal papers when drafting bibliographies for dissertations and publications.
Tracking Fast-Moving Literature
Identify recent follow-up studies and systematic reviews in rapid-output disciplines like artificial intelligence and biomedicine.
Editorial assessment
Pros and limitations
Where it is strong
- Intuitive visual representation of academic paper relationships
- Broad multidisciplinary coverage via the Semantic Scholar database
- Dedicated views for discovering seminal prior papers and subsequent review articles
- All analytical features included in the free tier up to 5 graphs per month
Where to be careful
- Free tier is restricted to 5 graph generations per month
- Focuses strictly on citation graph exploration rather than full-text PDF parsing or automated summarizing
Commercial context
Connected Papers pricing
At the review date (September 2026), Connected Papers offers a free tier granting 5 graphs per month. Unlimited access starts at $3 per month billed annually ($36/year) for academic and personal use, and $10 per month billed annually ($120/year) for business use. Verify exact terms and group options on the official pricing page.
| Plan | Price | What it includes |
|---|---|---|
| Free | $0 / month |
All features included with monthly usage limit |
| Academic | $3/month / month |
Billed annually at $36 USD. For academics, non-profits, and personal use. |
| Business | $10/month / month |
Billed annually at $120 USD. For business and industry use. |
Pricing, limits, taxes, model access, and regional availability can change. Verify the purchase-critical details on the official pricing page linked under Sources.
Transparent ranking
Why Connected Papers scores 70.9
Each factor is scored on a 100-point scale, then combined using the public ToolsRank weights. Engagement and momentum stay at a neutral baseline until measured signals exist, so no tool can gain or lose position from numbers nobody recorded.
Compatibility
Languages, platforms, and integrations
Languages
- English
Platforms
- Web
Integrations & surfaces
- Semantic Scholar
Community
Reviews and questions
No approved member reviews yet. Editorial factors above are the only rating on this page.
Reviews and questions come from Google-signed members and are checked by an editor before they appear.
Frequently asked
Connected Papers FAQ
Can I use Connected Papers for free?+
Yes. Connected Papers provides a free tier that includes access to all core features, limited to 5 graph builds per month.
What database does Connected Papers use?+
Connected Papers queries the Semantic Scholar database, which indexes hundreds of millions of academic publications spanning all scientific and academic disciplines.
What is the difference between Academic and Business plans?+
Both plans unlock unlimited graphs with all features included; the Academic plan is priced at $3 per month (billed annually at $36) for students, academics, non-profits, and personal use, while the Business plan is $10 per month (billed annually at $120) for industry and commercial use.
What are Prior and Derivative Works?+
The Prior Works view displays older, foundational papers that were cited heavily by the papers in your graph. The Derivative Works view shows subsequent literature reviews and state-of-the-art papers that built upon the graph's papers.